Content Performance
Track each published page through the AI funnel — bot crawls, search impressions, and AI-referred sessions — on the Content Performance tab.
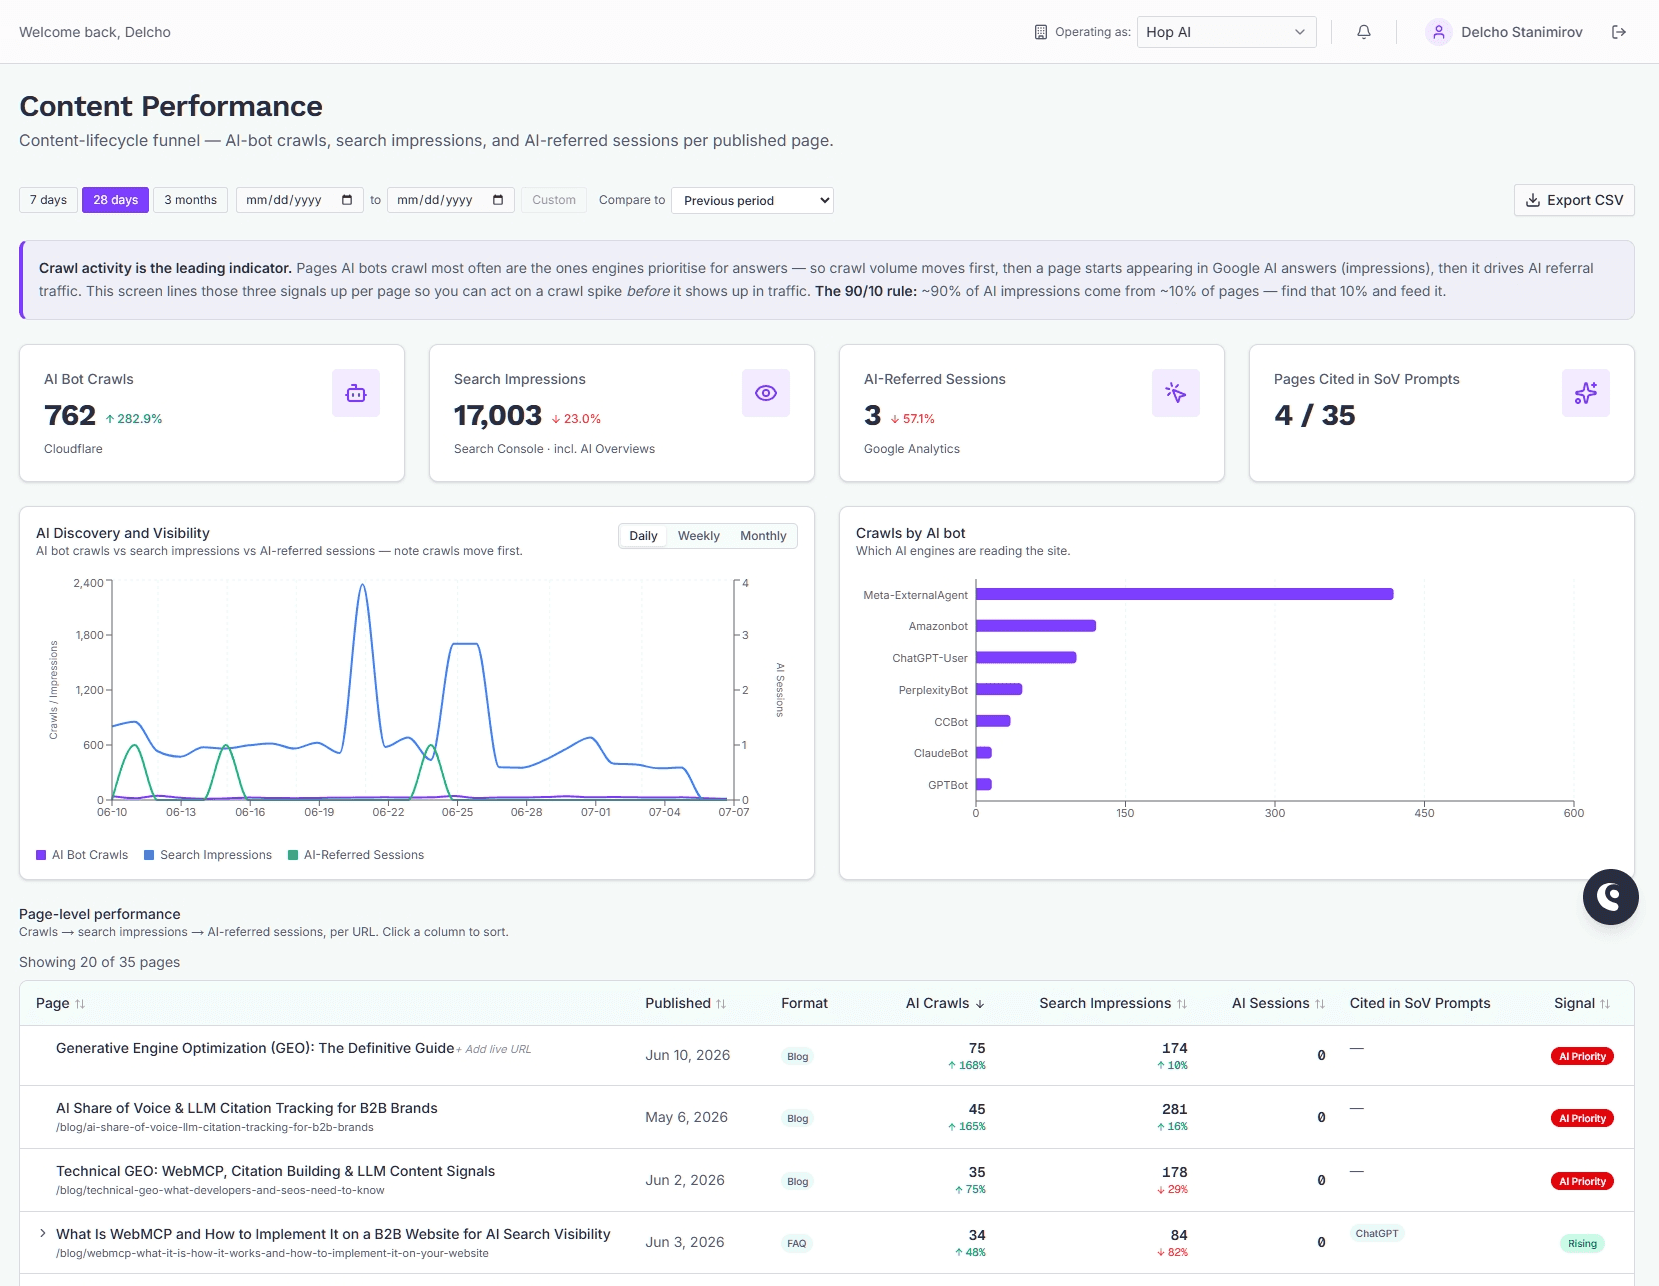
The Content Performance tab lines up three signals for every page you've published, in the order they tend to happen: AI bots crawl the page, the page starts appearing in search and AI answers, and then it drives AI-referred visits.
Crawl activity is the leading indicator. Pages AI bots crawl most often are the ones engines prioritise for answers — so crawl volume usually moves first, then impressions, then referral traffic. Watching the three together lets you act on a crawl spike before it shows up in traffic. As a rule of thumb, a small share of your pages earns most of your AI impressions — this tab helps you find that handful and keep feeding it.
The four scorecards
Across the top, each card shows a total for the selected period with its change versus the comparison period:
- AI Bot Crawls — how many times AI crawlers fetched your pages (from Cloudflare crawl tracking).
- Search Impressions — how often your pages appeared in Google Search, including AI Overviews (from Search Console).
- AI-Referred Sessions — visits attributed to AI sources (from Google Analytics).
- Pages Cited in SoV Prompts — how many of your pages showed up in the AI answers measured for your prompts, out of your total published pages.
If an integration isn't connected yet, its card shows a setup prompt instead of a number — Set up crawl tracking, Connect Search Console, or Connect Google Analytics — linking to where you can turn it on.
Charts
- AI Discovery and Visibility — crawls, impressions, and sessions plotted over time. Switch the aggregation between daily, weekly, and monthly.
- Crawls by AI bot — a breakdown of which crawlers (for example ChatGPT's or Gemini's) are fetching your pages most.
The per-page table
One row per published page, sortable by any column:
- Page — the title, linked to the live URL when one is recorded, otherwise to the piece in ContentForge. For WordPress, GEOforge re-reads each post's address daily, so a post that moves (for example when it's filed under a different category) keeps its numbers.
- Published — the go-live date, with a freshness badge when the page is getting on: Ageing past a year, and Refresh past eighteen months or whenever the URL still carries a year that has passed. Hover the badge for the reason.
- Format — Blog, FAQ, Case Study, or How To.
- AI Crawls, Search Impressions, AI Sessions — the count for each, with the percentage change versus the comparison period (green up, red down).
- Cited in SoV Prompts — badges for the AI sources that cited the page (such as ChatGPT, AI Overview, or AI Mode), or a dash if none. Expand a row to see the exact prompts.
- Signal — an at-a-glance verdict on where the page stands (see below).
Reading the Signal
Each page is tagged with one signal so you know what to do next:
- AI Priority — high crawl volume and strong AI impressions. Bots read it often and it appears in Google AI answers. A proven performer — keep it fresh and link to it internally.
- Rising — crawls climbing fast, but impressions and sessions haven't caught up yet. The leading indicator is firing; nurture it now.
- Watch — crawls or impressions slipping versus the previous period. Losing momentum — check content freshness and competitor movement before it cools.
- Cold — low crawl volume and few or no impressions. AI engines aren't prioritising it. A candidate for a refresh, consolidation, or stronger internal linking.
Reading the freshness badge
Age is one of only two things we can measure about a page that actually tracks whether AI engines cite it. Comparing pairs of pages on the same site that answer the same question, the newer one was cited about 1.75 times as often, on an average gap of just over two years. A year token in the URL does the same thing on its own: of two otherwise-matched pages, the one whose URL shows the newer year was cited roughly twice as often.
So the badge is a queue, not a verdict:
- Ageing — published more than a year ago, or the headline or SEO title mentions a year that has passed. Worth a look when you have room.
- Refresh — more than eighteen months old, or the URL carries a year that has passed. A stale year in the URL lands here on its own, however recently the page went live: it is the strongest of these signals, and it costs about half the page's citations by itself. These are your refresh candidates; the count above the table counts exactly these.
A page can be AI Priority and Refresh at the same time — and that is exactly the page to refresh first, because it already has the audience.
Nothing about freshness blocks publishing. It is advice, not a gate.
Time range, comparison, and export
- Pick a preset range — 7d, 28d, 3mo — or a custom range.
- Set Compare to to Previous period or Same period last year; every change figure is measured against that choice.
- Export CSV downloads the full table for the current range.
Related
- Share of Voice — your overall brand visibility, SoV trend, and competitor comparison.
- Site Analytics — full Google Analytics and Search Console drill-down.
- AI Crawlers — the raw AI-crawler activity behind the AI Crawls column, on the Site Analytics page.