Analytics
See AI-platform referral traffic from GA4 and branded search impressions from Google Search Console.
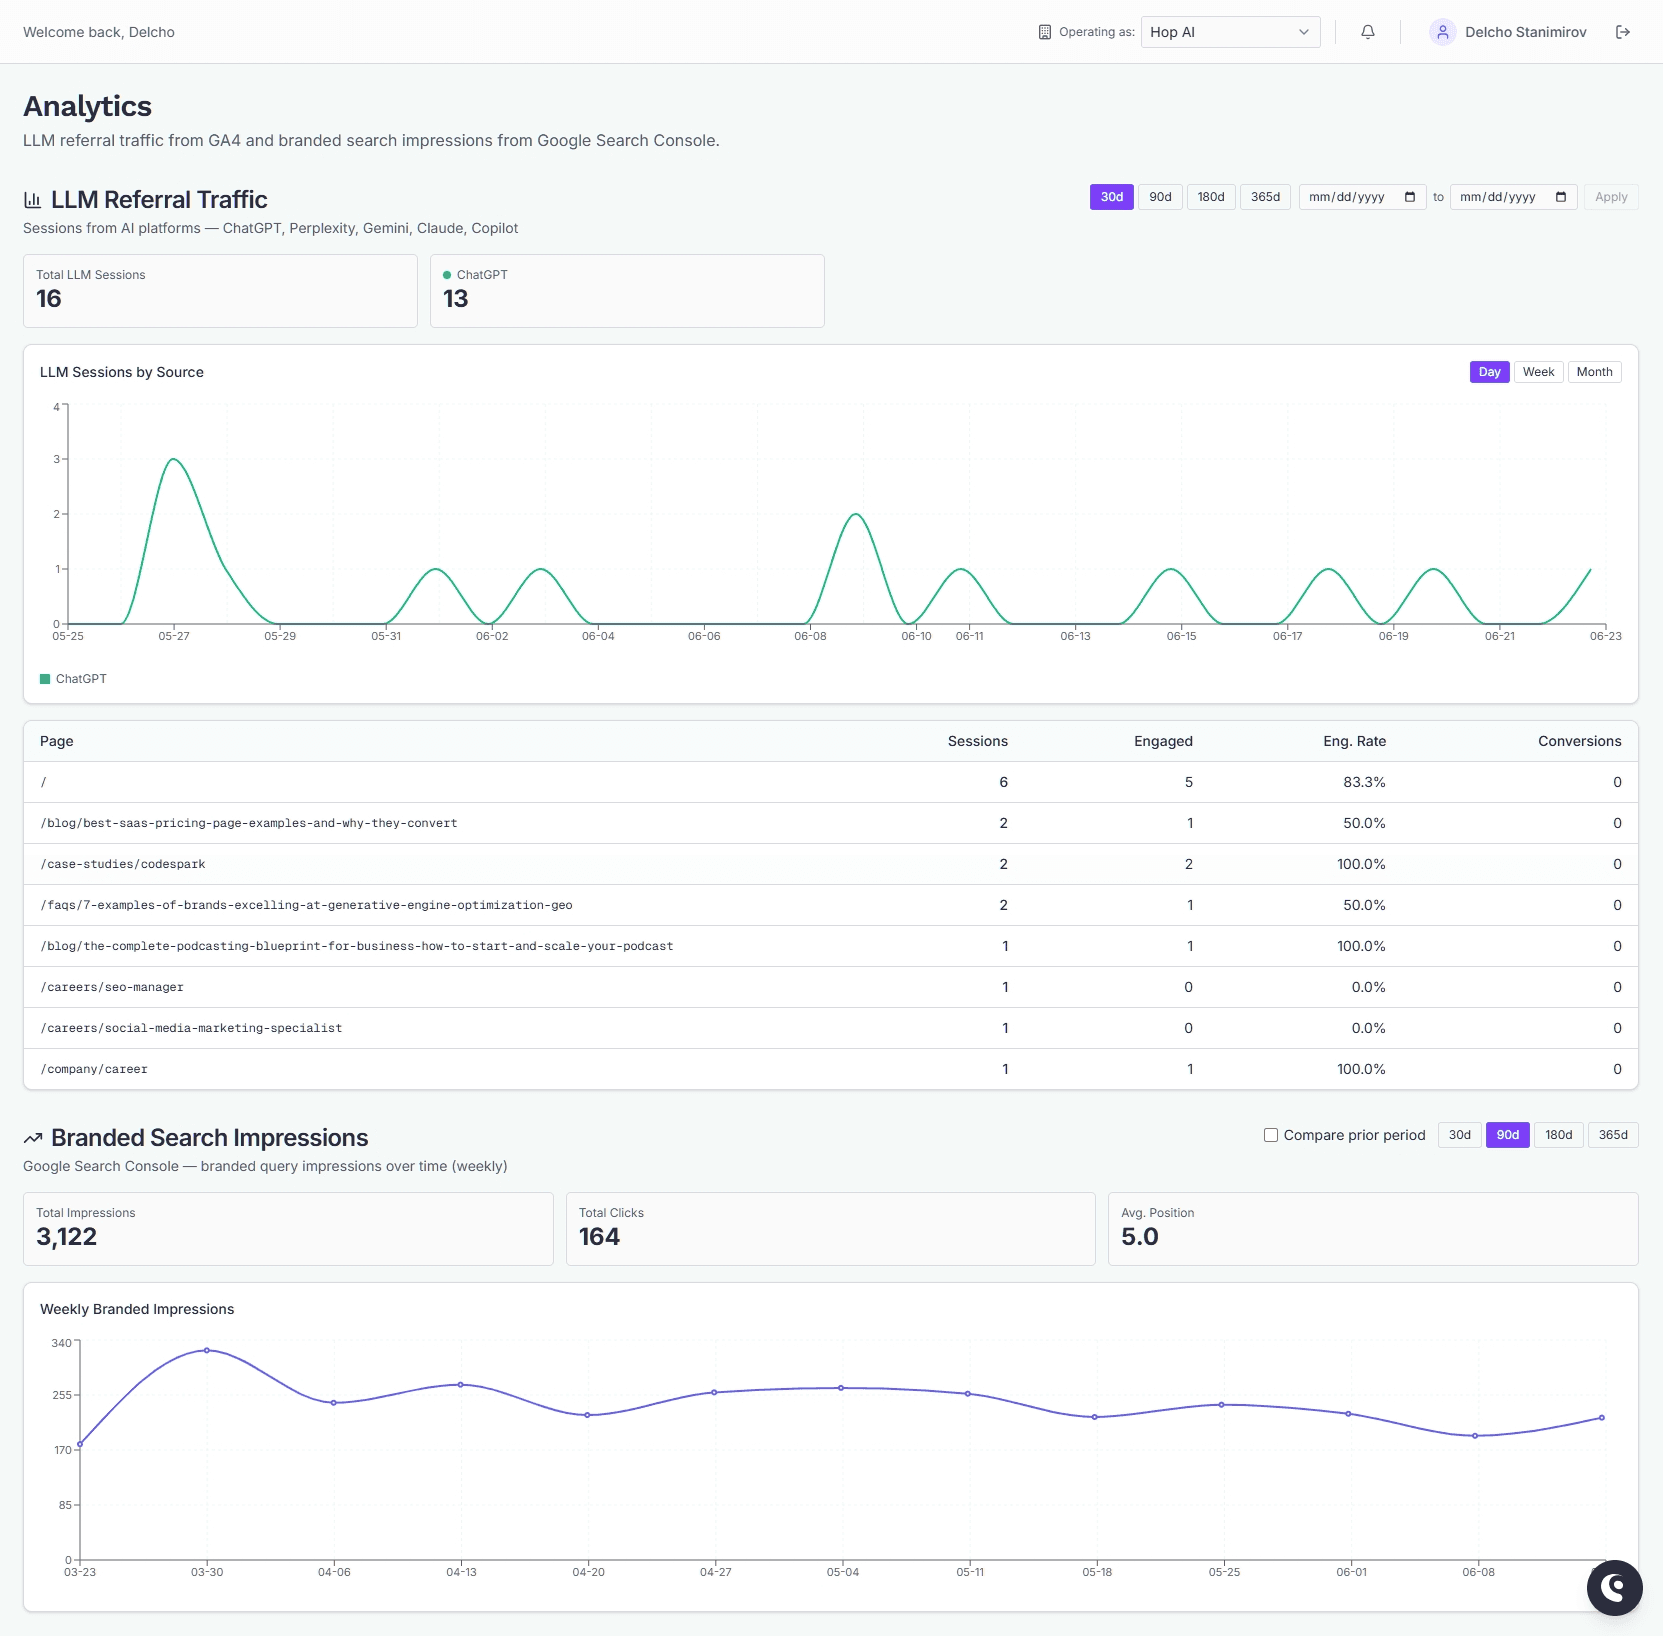
The Analytics tab shows two things: traffic that arrives on your site from AI platforms (via Google Analytics 4), and branded search impressions from Google Search Console. Both are downstream signals — they tell you whether your AI visibility is turning into visits and searches.
Connecting your data
Analytics reads from your Google account. Until you connect it, the page shows a prompt to do so.
To connect, go to Settings → Integrations and link Google Analytics. Once connected, the page shows whichever sources you've authorized:
- If GA4 is connected, the LLM Referral Traffic section appears.
- If Search Console is connected, the Branded Search Impressions section appears.
Each section is independent. You can connect one without the other.
LLM referral traffic
This section counts sessions that arrived from AI platforms — ChatGPT, Perplexity, Gemini, Claude, and Copilot.
At the top, summary cards show your total LLM sessions for the selected window, plus a per-source breakdown for the three largest sources.
Date range
Use the preset buttons (30d, 90d, 180d, 365d) or pick a custom start and end date and click Apply.
Sessions by source over time
The line chart plots sessions per platform across the window. Each platform is a separate line. Days with no traffic show as zero rather than being skipped, so the timeline stays continuous.
You can switch the chart between day, week, and month granularity using the buttons above it.
Page table
Below the chart, a table lists the top 20 pages receiving AI referral traffic, with:
- Sessions — total visits from AI platforms.
- Engaged — engaged sessions.
- Eng. Rate — engaged sessions as a percentage of total.
- Conversions — counted conversions on that page.
If no AI referral traffic is detected in the window, the section says so instead of showing an empty chart.
Branded search impressions
This section pulls branded query impressions from Google Search Console. Data is bucketed into whole weeks, so the date controls here offer presets only (30d, 90d, 180d, 365d) — an arbitrary from/to range would produce partial-week totals that look misleading.
Three summary cards show Total Impressions, Total Clicks, and Avg. Position for the window.
Comparing to a prior period
Tick Compare prior period to overlay the immediately preceding window of the same length. When enabled:
- Each summary card shows the percentage change versus the prior period, in green (up) or red (down). For Avg. Position, a lower number is treated as the improvement, since position 1 is better than position 10.
- The weekly impressions chart adds a dashed gray line for the prior period alongside the solid current line.
If no branded search data is found in the window, the section says so.
Reading these numbers together
LLM referral traffic and branded search impressions measure different points in the same funnel.
- Referral traffic is people who clicked through from an AI answer to your site.
- Branded impressions are people searching for your brand by name — often after encountering it in an AI answer or elsewhere.
Rising branded impressions with flat referral traffic can mean AI engines are mentioning you without linking you. If you want to see where engines cite you and your competitors, look at your Share of Voice and Prompt Library data.