Brand Share of Voice
Read the Share of Voice report — how LLMs mention your brand vs. competitors across your prompts.
The Brand Share of Voice page shows how often AI engines mention your brand compared with competitors across your prompts. Each completed batch run feeds this report. If you haven't run a batch yet, the charts read "Data appears after the first completed batch."
Share of Voice (SoV) here is a weighted score: your brand's share of all brand and competitor mentions across the runs in a batch. Direct mentions count more than citations or indirect references. This is different from a plain mention rate — a brand can be mentioned in many answers (high mention rate) yet still hold a small share of total mentions (low SoV).
A mention means your brand is named in the words a reader actually reads. Being listed as a source under the answer is a citation, and counts separately — it is not also a mention. The distinction matters because AI engines embed their source links inside the answer text, so an answer can link to your site several times without ever naming you.
A citation counts for whoever owns the cited page. A page on your website counts for you, and a page on a competitor's website counts for that competitor, even when the answer doesn't name them. If a competitor's website is set to one section of a larger site (for example, one specialist's page on a clinic's site), only that section counts for them. Google sometimes links its sources inside the answer text, or as numbered footnotes, rather than listing them underneath; those count as cited sources too.
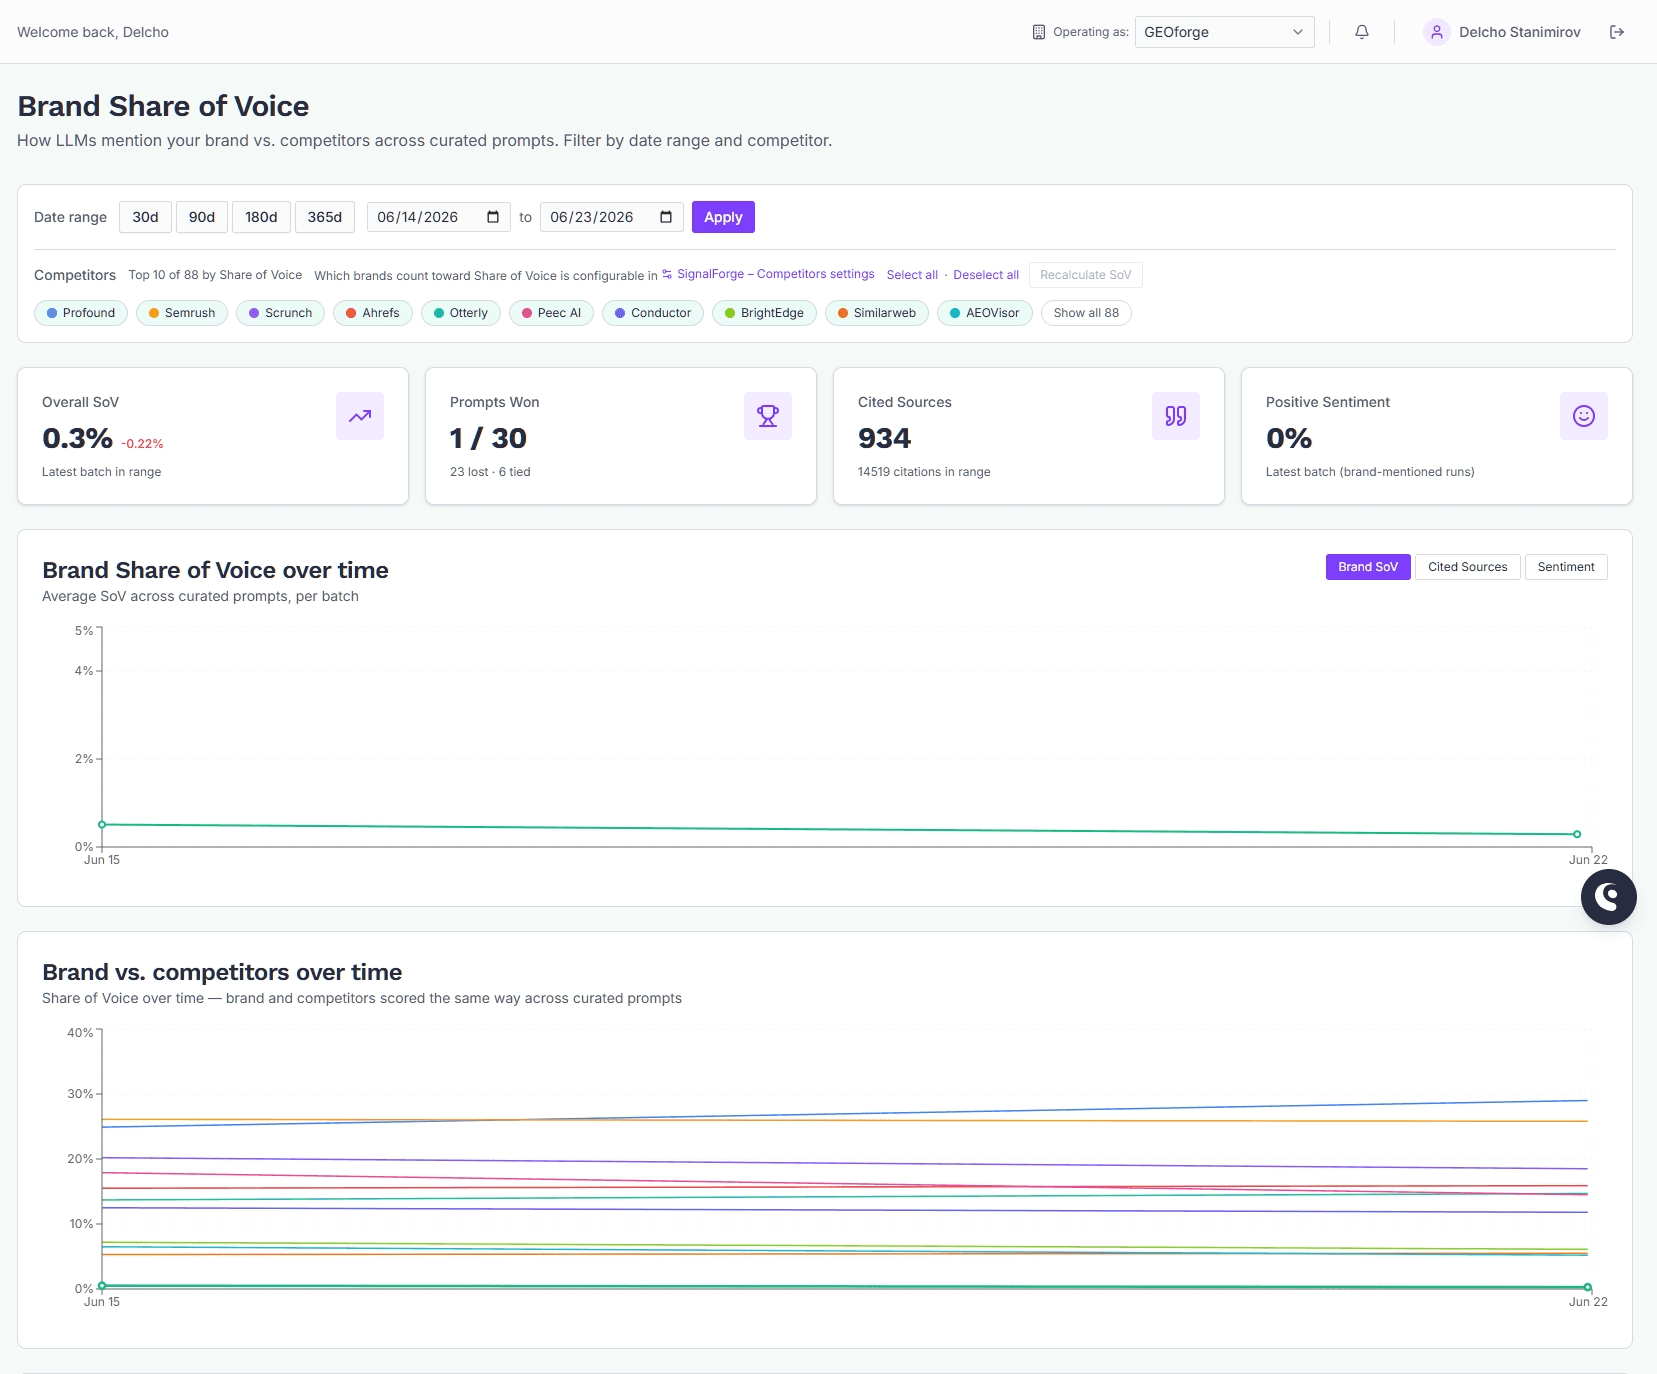
Summary cards
Four cards sit at the top, reflecting the latest batch in your selected range:
- Overall SoV — your brand's weighted SoV, with the change versus the previous batch. The change is left off when either batch is an incomplete cycle (see below). The card also shows:
- ± if re-measured — the measured 95% margin of error on the displayed figure. It answers one specific question: if GEOforge re-ran this week's measurement on the same tracked prompts, where would the number land? It is computed from your brand's actual answer-to-answer variability, not a fixed per-plan figure, so it isn't shown for measurement depths that can't support it (for example, single-run trial measurements).
- Real change / within measurement noise — the change verdict. A week-over-week move only counts as a real change when it is larger than its own measured noise; otherwise the card says so. Two numbers being different is not, by itself, evidence that visibility moved.
- Mention rate — the share of all answers that mentioned your brand at all, with its 95% likely range. For brands that appear in only a few answers, this range is the most honest way to read the number.
- Mention / Citation split — the same competitive formula counting only one signal each: named in the prose of the answer, or appearing in the cited sources.
- Prompts Won — how many prompts your brand led on, out of the total scored, with losses and ties noted.
- Cited Sources — the number of distinct domains AI engines cited, and the total citation count in range.
- Positive Sentiment — the share of brand-mentioned runs classified as positive in the latest batch.
Date range
Use the presets (30d, 90d, 180d, 365d) or enter a custom start and end date and click Apply. All charts and tables update to the selected window.
Source
GEOforge measures Share of Voice on three AI engines: ChatGPT, Google AI Mode and Google AI Overview. Which of them your brand is measured on is set up by GEOforge for your account. Contact us if you want to change it.
If your brand is measured on more than one, a Source filter appears. Each engine is a chip; selecting a subset shows the combined SoV across only those engines. At least one source stays selected. When every source is selected, you see the combined cross-engine view.
Include social channels
AI engines often cite a company's YouTube videos, LinkedIn posts or Facebook page instead of its website. Once you've confirmed the channels that belong to you and to each competitor in Settings → Social Channels, a citation of one counts like a citation of that company's website.
The Include social channels switch next to the date controls is on by default. Turn it off to see every chart and table measured on websites alone. It changes only what you're viewing.
Channels count only after every competitor's channels have been reviewed, so until then the switch makes no difference to your numbers.
Competitors
The competitor chips are ranked by Share of Voice, highest first. By default you see the top 10; use Show all to expand the full list. Click a chip to toggle a competitor in or out of the charts and tables.
Which brands count as competitors is configured in your Competitors settings, linked from this section. Share of Voice is measured only against that pre-set list — those competitors are the whole denominator.
Recalculate SoV
Toggling competitors off only hides their lines by default. To see what your SoV would be if those competitors were excluded from the calculation, deselect one or more competitors and click Recalculate SoV. GEOforge rescores the stored batch results without those brands and updates the Overall SoV card and brand lines.
This is a what-if view — it doesn't change your saved settings. Changing the selection again clears the recalculated numbers and reverts to the stored values until you recalculate again. Use Select all / Deselect all to reset the chips quickly.
Top timeline chart
The main chart switches between four metrics:
- Brand SoV — your average weighted SoV across your prompts, one point per batch. A shaded band around the line shows the margin of error: re-measuring the same week on the same prompts would land inside it 95% of the time.
- Cited Sources — the count of distinct domains AI engines cited, per batch.
- Sentiment — three lines (positive, neutral, negative) showing the share of brand-mentioned runs in each category. An independent grader classifies each answer that mentions your brand.
- SoV Split — the combined weighted SoV alongside the mention-only and citation-only shares, showing what the mention/citation weighting is doing. Gaps mean batches measured before split tracking existed.
Markers on the chart
An amber "!" marker on a batch means your prompt set changed since the previous batch — a prompt was added, edited, or retired. Hover it for the count. When prompts change, that batch isn't directly comparable to the one before it — see the prompt stability notice on the Prompt Library page.
A small tag just above the axis, such as gpt-5.2, marks the batch where an engine's answer model first shows up or changes. Hover it to see the change and how the batch's answers were split between models. A new model can move your numbers on its own, without anything changing on your site, so read a step at a tag with that in mind. Under the chart, Answer models names the model each engine uses now. Engines that don't report their model, such as Google's, have no tag.
Incomplete cycles
A point drawn as a dashed amber ring on the Brand SoV line is a cycle we can't compare with the one before it. There are five reasons a cycle gets flagged, and hovering the point tells you which. More than one can apply at once — if one engine failed while another is still working, you'll see both, because "still measuring" on its own would have you waiting for something that isn't coming:
- An engine is still measuring — for example, "Still measuring — Google AI Overview hasn't reported yet". Your engines don't finish together: they all start in the same run, but one can take several hours longer than another. This is the normal state of the newest point for part of the day your batch runs, and it clears itself as soon as the last engine reports. Nothing has gone wrong.
- Fewer answers than intended came back — for example, "1,425 of 1,800 answers collected (79%)". That happens when an AI engine rate-limits us, times out, or returns empty answers for part of a batch.
- An engine that measured last week produced no data this week — for example, "Google AI Overview produced no data this cycle", because its batch never ran or ran and failed. Your SoV pools the engines that answered, so a week missing an engine measures something slightly different from the week before it, even when every answer it did collect landed.
- Part of the cycle falls outside your selected dates — for example, "Partly outside the dates — Google AI Overview measured this cycle outside the selected dates". Your engines don't finish together, so a date range can open or close partway through a week's measurement. When that happens the point you're looking at is an average of only the engines inside the range, which is why we won't compare it. Widening the date range fixes this one — it's about your filter, not about your data.
- An engine measured this week that didn't last week — for example, "Engine set changed — Google AI Overview measured this cycle but not the one before". The mirror of "produced no data", read the other way round: an engine coming back (or being switched on for the first time) rejoins the pool, so the two weeks aren't measuring quite the same thing. This one is easy to under-rate. An engine that returns with a very different score moves your headline number by several points on its own, and that movement is arithmetic, not audience behaviour — which is exactly why we won't put a change arrow on it.
The "produced no data" and "engine set changed" flags mark the week the engine set changed, not every week afterwards. If you turn an engine off (or it stays down for a while), the weeks in between are all measuring the same thing as each other and compare normally — it's only each boundary that doesn't.
The point stays on the chart, at the value it actually measured. It's real data and we don't hide it. What we do withhold is the comparison: a flagged cycle is excluded from the change figure on the Overall SoV card, both as the latest batch and as the one before it. A week that collected a quarter of its answers can drift several points from a full week for no reason other than the missing sample, so calling that difference a trend would be misleading.
When a run comes back with well under the answers it intended, or fails outright, GEOforge also re-measures that engine sooner rather than waiting the full interval. The other flags don't trigger an early re-measure: an engine that's still measuring will finish on its own, and the date-range flag is about your filter, not your data.
Brand vs. competitors over time
This chart plots your brand's SoV against each selected competitor's SoV across batches, scored the same way. The brand line is emerald; competitors take distinct colors. The y-axis scales to the tallest visible line rather than a fixed 100%, so low-SoV brands aren't flattened.
Every line on this chart uses the same measure
Competitor lines use the same weighted Share of Voice as your own line, scored across the same pool of mentions, so the lines are directly comparable.
Competitor figures for earlier periods may not match numbers you noted previously — the underlying answers haven't changed, only the measure being plotted. Your own brand line is unaffected.
Mention rate is still the right measure in some places, and it's still what the Win / loss by prompt table below uses.
Share of Voice by tag
If you've tagged prompts in the Prompt Library, this table breaks your Share of Voice down by those groupings — so you can see, for example, whether you're strong on bottom-of-funnel questions and weak on comparison ones.
Each row covers the prompts carrying that tag which the latest batch measured:
- Prompts — how many that is. Because a prompt can carry several tags, it's counted under each of them, so these numbers deliberately don't add up to your prompt total.
- SoV — the average Share of Voice across that tag's prompts.
- Change — the average movement across the prompts measured in both batches, in percentage points.
- Mention rate — the average share of runs mentioning your brand at all.
Two cautions on the Change column. It's shown deliberately plainly, with no colour and no ± band, because a handful of prompts isn't enough to say whether a move is real — read it as a direction to look into, not a result. And it's blank whenever the two batches aren't comparable, for the same reason the headline change is.
The table only appears once you've tagged at least one measured prompt.
Win / loss by prompt
A table of each prompt, ordered to match the Prompt Library numbering. For each prompt it shows your brand's mention rate, the strongest competitor and their mention rate, and the outcome (win, loss, or tie) for the latest batch.
Note that "Brand mention rate" here is the percentage of runs that mentioned your brand at all — not the weighted SoV.
Sources LLMs cite
A table of the top domains AI engines cited across runs in range, with total citations, how many came from runs that mentioned your brand, and an example link. Use this to see which sources are shaping answers about your category.
If your Overall SoV is low, the Win / loss and Sources tables show where competitors are winning and which sources to target.